Annual highlights of the telecommunications sector 2021


© His Majesty the King in Right of Canada, as represented by the Canadian Radio-television and Telecommunications Commission, 2023
ISSN 2564-369X
Catalogue No. BC9-34E-PDF
This report contains highlights of the telecommunications sector for calendar year 2021 and concludes the 2021 telecommunications data collection cycle.
On this page
- Executive summary
- Market composition
- Revenues
- Financial performance
- Sector summaries
- Datasets available on Open Data
- Methodology
The CRTC conducts several surveys where it collects and validates large quantities of data to actively monitor the Telecommunications market. In the past two years, it has been working on modernizing and redesigning the Communications Markets Reports (CMR) publications and the data collection program that supports it. To do so, the CRTC has been investing in new technologies and adopted streamlined approaches and has prioritized the release of data in a timelier fashion and in more frequent intervals (e.g., quarterly).
As a result of these investments, the CMR publications now include Open DataFootnote 1, which include over 400 up to date datasets available for public use; Current TrendsFootnote 2, that provide the latest data and trends as soon as they have been validated; and two Annual Highlights reports that provide a more in-depth look at the Telecommunications and Broadcasting sectors.
In 2022, priority was given to the validation and timely release of 2021 data from the CRTC Facilities Survey, the CRTC Communications Pricing Survey, and the Annual Telecom Survey. Responses to these surveys were due March 31, 2022, and the CRTC started to release data in May 2022, when statistics from the CRTC Communications Pricing Survey for year-end 2021 were released on Open Data, as well as under the Mobile Wireless and High-Speed Broadband sections of Current Trends. In October 2022, the mobile coverage data from the CRTC Facilities Survey were released under the Mobile Wireless section, while the broadband coverage data from the same survey were published in November 2022 under the High-speed broadband section.
The results of the 2021 Annual Telecom Survey, which is the foundation of the Telecommunications Annual Highlights, were published on Open Data in November 2022.
With its investment in new technologies, and its new streamlined data collection and validation processes now in place, the CRTC has the tools to release data not only in a timelier fashion, but also in a more transparent and accessible way. The timing of the releases of the future iterations of the Annual Highlights will benefit from these improvements.
Executive summary
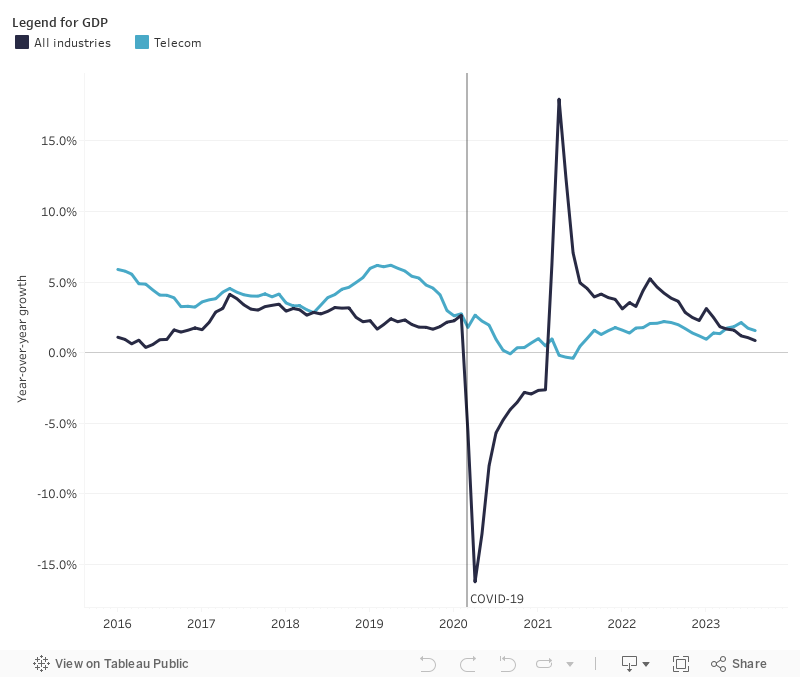
The year 2021 was marked by the easing of restrictions and measures from the COVID-19 pandemic and telecommunications remained vital to the activities of Canadians. Border restrictions were lifted causing an increase in non-essential travel, and many Canadians started adopting a hybrid work model, a combination of telework and on-site work. The telecommunications industry recorded a continued surge in Internet data usage and increases in mobile roaming revenues. The telecommunications sectors contribution to GDP rebounded in 2021, as the economy as a whole started recovering from the negative impact of the pandemic (see Figure 1).
Accessibility
Visual data browsing cannot be done through the screenreader but the equivalent of that graphed data can be downloaded for browsing.
Please note not all of the items listed on the following page apply to our dashboards: Keyboard Accessibility for Tableau on the Web (opens a new window to an external link)
Figure 1 - Gross domestic product (GDP) growth rate (%) in Canada
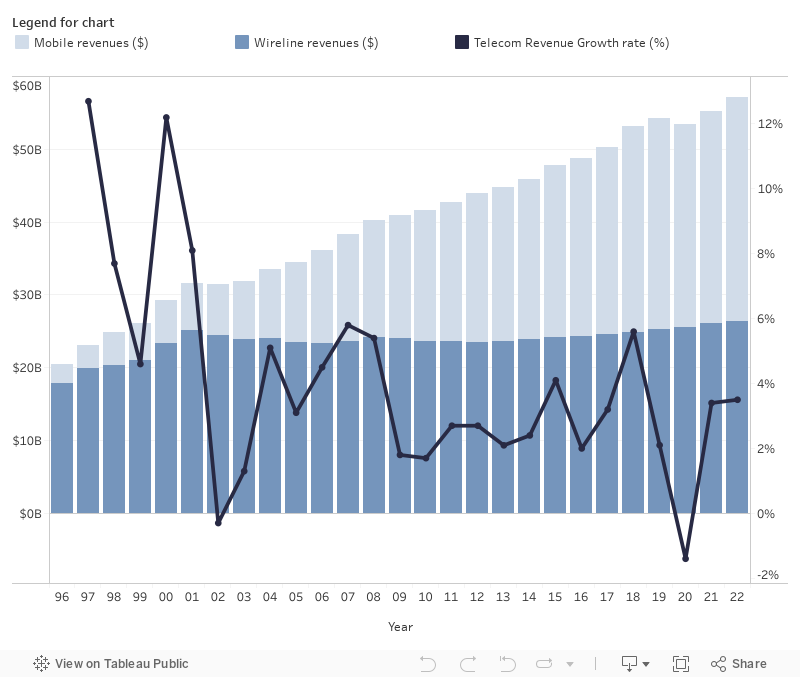
The telecommunications sector experienced a 3.4% increase in total revenues in 2021 when compared to 2020 which recorded the largest revenue decrease (1.4%) since the CRTC has been publishing the Communications Market Reports (CMR, formerly referred to as the Communications Monitoring Report) (see Figure 2). The only other decrease was recorded in 2002 at the end of the dot-com bubble, which resulted in a less significant 0.3% revenue drop. Total revenues in 2021 grew by 1.9% compared to their 2019 pre-COVID-19 level. The increase in total Canadian telecommunications revenues in 2021 is primarily due to the almost $1.3B increase in mobile revenues, as total mobile increased by 4.5%, after decreasing for the first time since the CRTC has been publishing the CMR, and the almost $0.6B increase in wireline revenuesFootnote 3, an increase of 2.2%.
While still increasing their revenues, wireless carriers, as a group, reported slightly lower EBITDA margin, lower churn rates, and increased capital investments on 5G networks. From the consumer perspective, the average subscriber used more data than ever before, and continued to subscribe to larger data plans.
The retail fixed Internet sector performed well, and was one of the two telecommunications sectors to experience revenue growth, growing 9% to almost $14.5 billion. Continued residential subscriber movement towards higher speed packages drove this growth, and business Internet revenues were impacted positively by the gradual reopening of businesses during the pandemic. In addition, with the ongoing pandemic, Internet service became more of a necessity than ever for Canadians for remote work and education, to access news and information, as well as for entertainment. This was evident as data usage surged substantially while many schools and workplaces transitioned online.
In 2021, Mobile services remained the largest sector, representing over 54.4% of all retail telecommunications revenues in 2021. Its revenues experienced a 4.3% rebound as it increased from $25.9 billion in 2020 to $27.0 billion in 2021. This was driven in part by a 9.9% increase in data revenues, which reached $12.5 B in 2021, and by Mobile equipment and device sales which increased by 8.5% in 2021 compared to 2020. Moreover, the average subscriber consumed more data than ever – a growth rate of data usage of 8.6% from 2020 to 2021.
Accessibility
Visual data browsing cannot be done through the screenreader but the equivalent of that graphed data can be downloaded for browsing.
Please note not all of the items listed on the following page apply to our dashboards: Keyboard Accessibility for Tableau on the Web (opens a new window to an external link)
Figure 2 - Total telecom revenues ($ billions) and growth rates (%)
Market composition
Canadian telecommunications revenues totalled $55.3 billion in 2021, as Canadians used ever-increasing amounts of data through both fixed Internet and mobile services (“Data usage” includes the use of data for video streaming services such as Netflix and YouTube, as well as for audio streaming services such as Spotify and various radio applications via mobile devices or fixed Internet services).

Long description
| Sector | 2020 | 2021 | Growth (%) 2020-2021 | CAGR (%) 2017-2021 |
|---|---|---|---|---|
| Mobile | $27.9 B | $29.2 B | 4.5 | 3.2 |
| Fixed Internet | $14.1 B | $15.3 B | 8.4 | 7.3 |
| Local and access | $5.9 B | $5.6 B | -4.6 | -5.6 |
| Data | $3.1 B | $3.0 B | -5.6 | -1.9 |
| Long distance | $1.3 B | $1.3 B | -4.6 | -4.3 |
| Private line | $1.1 B | $1.0 B | -10.1 | -6.6 |
| Total | $53.4 B | $55.3 B | 3.4 | 2.4 |
Total telecommunications revenue is calculated from exact amounts and may appear to differ from total sector revenues due to rounding.
Data may change from year to year for several reasons, including economic growth or decline, merger and acquisition activity, industry reclassification, changes in methodology, and revisions to the data.
Service providers are divided into two broad categories: incumbent telecommunications service providers (incumbent TSPs), which provided local telecommunications services on a monopoly basis prior to the introduction of competition, as well as other types of service providers.
These other types of service providers include cable-based carriers, which are the former cable monopolies that currently also provide telecommunications services; other facilities-based service providers; and wholesale-based service providers, which are companies providing services primarily using other companies’ facilities.
Incumbent TSPs, along with cable-based carriers, own and operate the majority of the infrastructure used by wholesale-based service providers.
Refer to the methodology section for more details.
| Type of TSP | Revenue share (%) | Growth (%) 2020-2021 | CAGR (%) 2017-2021 |
|---|---|---|---|
| Large incumbent TSPs | 56.0 | 2.1 | 1.4 |
| Small incumbent TSPs | 1.0 | 7.2 | 4.1 |
| Cable-based carriers | 35.7 | 5.1 | 3.6 |
| Other facilities-based carriers | 3.8 | 6.8 | 6.8 |
| Wholesale-based service providers | 3.5 | 3.1 | 1.4 |
Examples of large incumbent TSPs include Bell, SaskTel, and TELUS.
Examples of small incumbent TSPs include Execulink and Sogetel.
Examples of cable-based carriers include Rogers, Shaw, Eastlink and Vidéotron.
Examples of other facilities-based carriers include Allstream Business and Xplore (previously known as Xplornet).
Examples of wholesale-based service providers include CIK Telecom and TekSavvy.
Growth and CAGR are calculated from the revenues in billions of dollars.
The five largest providers of telecommunications services (including affiliates) accounted for 87.2% of total revenues in 2021. These company groups are Bell, Rogers, TELUS, Shaw, and Quebecor. They are a mix of incumbent TSPs and cable-based carriers, and all are facilities-based service providers. The percentage of revenues represented by the top five changes slightly from year to year. Significant changes are usually due to factors such as ownership transfers.
Since 2017, revenues for large incumbent TSPs have increased by about 1.4% per year on average, while revenues for small incumbent TSPs increased by 4.1%. During the same period, the revenues of cable-carriers increased by 3.6% per year on average.
While large incumbent TSPs represented 0.7% of all telecommunications providersFootnote 4 in 2021, they generated 56% of revenues. Cable-based carriers made up 7.1% of the total number of telecommunication providers and generated 35.7% of revenues. With relatively lower barriers to entry, wholesale-based service providers comprised nearly 67.2% of service providers while generating 3.5% of revenues.
Scroll
View data
Revenues
In the Communications Market Report, telecommunications services are divided into six sectors:

Long description
| Type | Subtype | Sector | 2021 |
|---|---|---|---|
| Wireline | Wireline voice | Local and access | 10.2% |
| Wireline | Wireline voice | Long distance | 2.3% |
| Wireline | Wireline data | Data | 5.4% |
| Wireline | Wireline data | Private line | 1.7% |
| Wireline | Wireline data | Fixed Internet | 27.6% |
| Wireless | Mobile voice and data | Mobile | 52.8% |
In 2021, only nine company groupingsFootnote 5 offered services in all six telecommunications sectors, however, they accounted for 85.8% of total telecommunications revenues in Canada. At the other end, companies providing services from one to three service sectors generally offered Internet access, local phone service, or long-distance phone services. These smaller entities, often wholesale-based service providers, represented 73.5% of the total number of TSPs, but generated only 4.7% of telecommunications revenues in 2021.
Scroll
View data
Scroll
View data
The six service categories include: Local and access, Long distance, Data, Private line, Internet and Mobile.
Retail versus wholesale
Telecommunications services revenues come from both retail sales (i.e., sales to residential consumers and business customers) and wholesale sales (i.e., sales to other providers of telecommunications services).

Long description
| Description of service | Type of TSP | Market | Category | 2020 | 2021 |
|---|---|---|---|---|---|
| Services provided directly to the end-user | Retail services are generally provided by all TSPs | Retail | Revenue share | 92.3% | 92.9% |
| Services provided directly to the end-user | Retail services are generally provided by all TSPs | Retail | Revenues | $49.3 B | $51.3 B |
| Services provided by one TSP to another, then to the end-user | Wholesale services are provided by facilities-based TSPs | Wholesale | Revenue share | 7.7% | 7.1% |
| Services provided by one TSP to another, then to the end-user | Wholesale services are provided by facilities-based TSPs | Wholesale | Revenues | $4.1 B | $3.9 B |
Retail revenues increased slightly to account for 92.9% of total telecommunications revenues in 2021, hovering at around 92% to 93% in the past five years. Approximately 95.7% of mobile revenues were generated from retail services, compared to 88.5% for wireline. Those numbers have remained virtually unchanged since 2013.
The roaming and other revenuesFootnote 6 represented approximately 4% of total retail mobile revenues in 2019 compared to approximately 3% in 2020 and 2021. Retail and wholesale mobile roamingFootnote 7 revenues were severely impacted by the pandemic and had not returned to pre-COVID-19 level in 2021. Total wholesale mobile roaming revenues grew by approximately 3% in 2021. Roaming revenues were largely generated from subscribers who used mobile services in the United States.
Canadian retail telecommunications service revenues increased 4.1% to $51.3 billion in 2021. In Ontario, revenues from these services reached $20.3 billion (36.7% of all telecommunication revenues in Canada). Revenues in Quebec were $10.1 billion (18.4%), British Columbia accounted for $7.1 billion (12.9%), and revenues in Alberta reached $6.5 billion (11.8%).
The wholesale telecommunications market saw a similar trend, with Ontario leading the provinces/territories at 3.1% ($1.7 billion) of all telecommunication revenues generated by wholesale services, followed by Quebec at 1.5% ($0.8 billion) and the prairies region with 1.1% ($0.6 billion).
Scroll
View data
The number of wholesale Internet lines decreased in 2021, declining by 4.7% to slightly less than 1.3 million lines across Canada. Ontario maintained the highest share of wholesale lines with 0.7 million lines (57.9%); Quebec had the second largest share with 0.3 million (27.1%), and the rest of Canada totaled approximately 0.2 million (15.0%).
Nova Scotia saw a significant growth in the number of wholesale lines (addition of over 8,000 wholesale lines). This growth very largely contributed to the 19.9% increase of wholesale lines in the Atlantic region (Newfoundland and Labrador, New Brunswick, Prince Edward Island, and Nova Scotia) which grew from approximately 47,000 to 56,000 lines in 2021.
Scroll
View data
Forborne services
The Commission has chosen not to regulate when it finds that a service is subject to sufficient competition to protect the interests of users and is consistent with the Canadian telecommunications policy objectives, as outlined in section 7 of the Telecommunications Act. This is referred to as forbearance. Where a service is forborne, the Commission does not set prices for that service. The Commission has forborne from regulating most retail rates.
In 2021, approximately 96.5% of telecommunications revenues have been generated from forborne services. The percentage of revenues derived from forborne services ranged from a low of 74.7% in private line, to a high of 99.7% in mobile.
Canadian ownership
Section 16 of the Telecommunications Act addresses the eligibility of Canadian companies to operate as telecommunications common carriers.
Subject to certain exceptions, section 16 requires that telecommunications companies that own or operate telecommunications transmission equipment and have annual revenues from the provision of telecommunications services in Canada that represent more than 10% of the total annual revenues from the provision of telecommunications services in Canada, be Canadian-owned and controlled.
Total annual revenues from the provision of telecommunications services in Canada were $55.3 billion in 2021, and therefore, for the purposes of applying provisions of section 16, 10% of total revenues represents $5.5 billion.
Contribution – subsidization of high-cost residential local telephone service
The total amount of subsidies paid to local exchange carriers (LECs) was $18.0 million in 2021, down from $49.9 million (63.4% decrease) in 2020.
This subsidy represents contributions by TSPs, or groups of related TSPs that have a minimum of $10 million in annual Canadian telecommunications revenues toward the provision of residential local telephone service in high-cost serving areas (HCSAs). HCSAs are areas where the cost of providing service is substantially higher than in other parts of an incumbent LEC’s territory. HCSAs are often remote or rural areas.
In Telecom Regulatory Policy 2016-496, the Commission determined that to help achieve the new universal service objectiveFootnote 8, it would begin to shift the focus of its regulatory frameworks from wireline voice services to mobile wireless and fixed broadband Internet access services by deeming them as basic telecommunications services under the Telecommunications Act and by creating the CRTC Broadband Fund.
Scroll
View data
Scroll
View data
Financial performance
This section focuses on metrics such as capital expenditures, capital intensity, investments to acquire spectrum, earnings before interest, taxes, depreciation, and amortization (EBITDA). These are key indicators that can be used to evaluate the financial performance of the Canadian telecommunication industry by showing the amount of capital that is being reinvested back into maintaining and improving telecommunications networks. Looking at churn, despite the different lens of retail and business subscriptions, also provides an interesting perspective.

Long description
| Metric | Category | 2017 | 2021 |
|---|---|---|---|
| Capital expenditures ($ billions) | Wireline | $9.7 B | $9.5 B |
| Capital expenditures ($ billions) | Mobile | $2.3 B | $3.7 B |
| Capital intensity (%) | Mobile providers | 9.1% | 12.7% |
| Capital intensity (%) | Wireline incumbents TSPs | 42.8% | 48.0% |
| Capital intensity (%) | Wireline cable-based carriers and other facilities-based carriers | 47.5% | 32.8% |
| EBITDA margin (%) | Wireline | 37.0% | 35.7% |
| EBITDA margin (%) | Mobile | 39.5% | 45.8% |
| Investment in spectrum ($ millions) | Mobile | $442.4 M | $8,923.8 M |
Capital expenditures and capital intensity
Capital expenditures, or CAPEX, are investments made primarily to maintain or upgrade telecommunications networks. As such, it is a leading indicator for economic and business conditions of the telecommunications industry in Canada. With COVID-19 restrictions and their impacts, many companies had slowed the flow of capital investments in 2020. In 2021, CAPEX saw an important rebound, and exceeded levels observed in 2019. Total capital expenditures increased 15.9% with wireless and wireline reporting a 32.4% and 10.6% growth, respectively, compared to 2020. Approximately 37.8% ($1.4 billion) of the total wireless capital spent in 2021 was invested for 5G networks.
Between 2017 and 2021, wireline CAPEX decreased at an average annual rate of 0.6%. The large incumbent TSPs’ share of wireline CAPEX has seen an increase from 60.1% to 67.2% over the same period. The wireline CAPEX share of cable-based carriers has decreased from 39.6% in 2017 to 32.0% in 2022. Large telecommunications service providers spent $13.2 billion on CAPEX, $9.5 billion on wireline networks and $3.7 billion in wireless networks in 2021.
Scroll
View data
The telecommunications industry is capital intensive, taking considerable investment to build, maintain, and upgrade extensive network infrastructure. In 2021, the capital intensity (the ratio of capital expenditures to revenues) of the telecommunications industry was 25.6%, behind the utilities industry, and educational services, health care and social assistance industry.
The capital intensity of the Top 5 groups (Bell, Rogers, Shaw, TELUS, and Quebecor) was 25.2%. These TSPs accounted for 90.7% of the total telecommunications CAPEX in 2021, a small increase from 90.5% in 2020.
Accessibility
Visual data browsing cannot be done through the screenreader but the equivalent of that graphed data can be downloaded for browsing.
Please note not all of the items listed on the following page apply to our dashboards: Keyboard Accessibility for Tableau on the Web (opens a new window to an external link)
Figure 10 - Capital intensity for industries with the highest capital intensity ratios (%), 2021
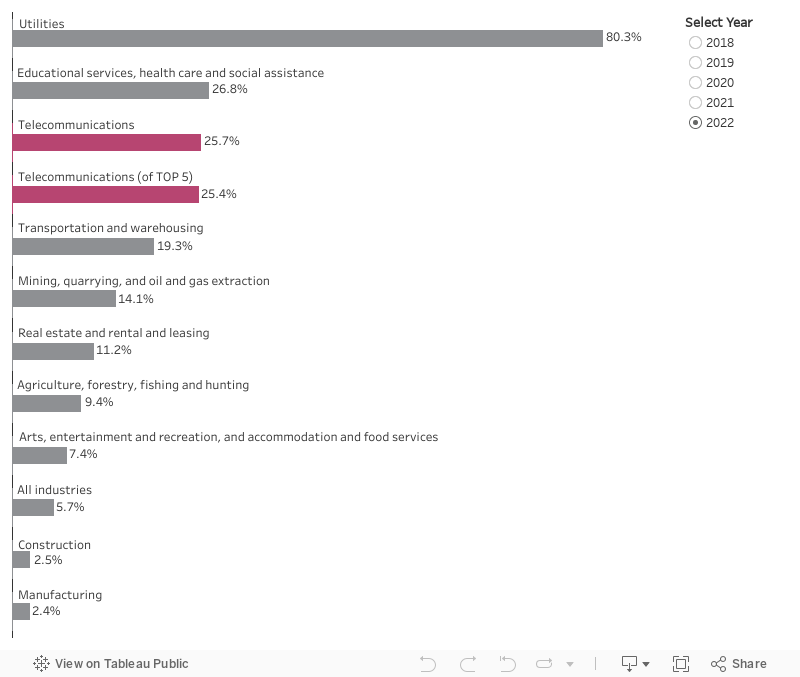
Since many carriers do not recognize and report spectrum as a CAPEX, the investments made in spectrum were not included in the figure above.
Wireline capital intensity can fluctuate. It was on the decline for cable-based carriers, decreasing from approximately 50.5% in 2017 to 30.6% in 2021. However, over the same period, wireline capital intensity for incumbent TSPs and for other facilities-based service providers increased from 42.8% to 48.0% and from 22.1% to 54.6% respectively. These rises were driven by a significant increase in CAPEX to expand and enhance networks.
Wireless capital intensity for mobile providers slightly increased. It was around 9.1% in 2017 compared to 12.7% in 2021.
Scroll
View data
Earnings before interest, taxes, depreciation, and amortization (EBITDA)
EBITDA margins (i.e., EBITDA as a percentage of total telecommunications revenues) are important in assessing the financial performance of a company or group of companies. Margins are calculated for TSPs with at least 80% of their total revenues represented by telecommunications services. For more details about how EBITDA was derived, see the methodology section.
Over the 2017-2021 period, margins for wireless services were consistently above those for wireline, with the difference widening to 10.1% as wireless margins reached 45.8%, in 2021.
Scroll
View data
Over the 2017-2021 period, the average EBITDA margins were at around 44.4% for the cable-based carriers and 39.5% for the incumbents.
Investment in auctioned spectrum
Annual investments in auctioned spectrum from 2014 to 2021 were $5.26 billion (2014), $2.96 billion (2015), $0.15 billion (2016), $0.44 billion (2017), $0.12 billion (2018), $3.5 billion (2019), $0.15 billion (2020), and $8.9 billion (2021) respectivelyFootnote 9. Investments made from 2014 to 2021 reflect investments made by mobile carriers to acquire auctioned Advanced Wireless Services-3 (AWS-3), Personal Communications Services-G block (PCS-G), and 700 megahertz (MHz), 2300 MHz, 2500 MHz, 600 MHz, and 3500 MHz spectrum.
Churn
The average churn rate is a measure of subscriber turnover. A higher churn rate suggests that customers are leaving their existing providers for several reasons, including dissatisfaction with the service, pricing issues or a desire to take advantage of competitive offers. Conversely, lower churn rates indicate that customers are not switching providers, which may indicate that customers see value in remaining with their current provider or that there are a lack of incentives motivating them to switch providers, including a lack of alternatives. Average monthly mobile churn rates have been steadily decreasing over the past four years, going from 1.5% in 2017 to 1.1% in 2021. Average monthly residential Internet churn rates have decreased from 2.0% in 2017 to 1.5% in 2021, and average monthly business Internet subscription churn has slightly decreased from 1.4% to 1.2% over the same period.
Sector summaries
This section provides a summary of the six retail sectors (mobile, fixed Internet, local access, long-distance, data, and private line) and the wholesale market within the Canadian telecommunications industry. Additional data for all markets can be found in Open DataFootnote 10.
In 2021, total Canadian telecommunications revenues experienced a rebound from 2020 and increased by 3.4% to $55.3 billion. Total retail telecommunications revenues, which represents most telecommunications revenues, totaled $51.3 billion in 2021, increasing by 4.1% from 2020 to 2021, and, on average, growing 2.6% annually from 2017 to 2021. Retail mobile and fixed Internet services sectors recorded revenue growths of 4.4% and 9.0% respectively in 2021.

Long description
| Sector | Mobile | Fixed Internet | Long distance | Data | Local and access | Private line |
|---|---|---|---|---|---|---|
| Retail revenues ($ billions) | $27.9 B | $14.5 B | $0.9 B | $2.3 B | $5.1 B | $0.6 B |
| Retail revenue growth (%) | 4.4% | 9.0% | -10.7% | -2.5% | -3.2% | -6.3% |
In terms of retail revenues, the mobile sector was the main contributor to the overall total retail telecommunications revenues in 2021. The mobile sector had a positive growth rate, adding over $1.2 billion or 4.4% in 2021, and remained the largest sector, accounting for over half (54.4%) of all retail telecommunications revenues in 2021. The fixed Internet sector made up over a quarter (28.3%) of all retail revenues, exhibiting the largest increase over the previous year, increasing by 9.0%. Revenues of all remaining sectors continued to decline over the past five years.
Retail mobile sector – A focus on mobile phone
In 2020, the CRTC revamped the data collections for the mobile sector to capture mobile services in three distinct categories instead of one: 1. Mobile phone (MP) 2. Mobile broadband and 3. Other plans for mobile connected devicesFootnote 11.
| Retail mobile | 2020 | 2020 (MP) | 2021 (MP) |
|---|---|---|---|
| Total mobile sector revenues ($ billions) | $26.8 B | NA | NA |
| Mobile phone revenues ($ billions) | NA | $25.9 B | $27.0 B |
| Mobile broadband revenues ($ billions) | $0.4 B | NA | NA |
| Other plans for mobile connected devices revenues ($ billions) | $0.4 B | NA | NA |
| Subscribers (millions) | NA | 32.4 M | 33.6 M |
| Annual revenue growth (%) | -3.2% | NA | 4.3% |
| Revenue CAGR (%) 2017-2021 | 3.6% | NA | NA |
| Subscribers with data plans (%) | NA | 83.5% | 85.6% |
| Average mobile data subscriber monthly data usage (GB) | NA | 3.7 GB/month | 4.7 GB/month |
| Monthly ARPUFootnote 12 ($) | NA | $66.70 | $68.24 |
| Blended prepaid/postpaid average churnFootnote 13 rate of Canada’s Top 3 mobile service providers (%) | NA | 1.20% | 1.16% |
| Component | 2017 | 2018 | 2019 | 2020 (MP) | 2021 (MP) | Growth (%) 2020-2021 | CAGR (%) 2017-2021 |
|---|---|---|---|---|---|---|---|
| Basic voice | 9,219.7 | 7,747.3 | 7,718.4 | 7,055.1 | 6,477.2 | -8.2 | NA |
| Long-distance | 481.9 | 417.4 | 367.5 | 366.3 | 357.5 | -2.4 | NA |
| Paging | 8.9 | 9.0 | 13.2 | 10.7 | 10.3 | -3.8 | NA |
| Terminal equipment (including handheld devices) | 1,896.1 | 6,961.9 | 7,121.8 | 6,330.5 | 6,869.9 | 8.5 | NA |
| Data | 11,832.4 | 10,857.0 | 11,284.0 | 11,355.4 | 12,473.7 | 9.9 | NA |
| Roaming and other | 1,047.2 | 1,125.0 | 1,151.3 | 794.0 | 833.1 | 4.9 | NA |
| Total | 24,486.2 | 27,117.7 | 27,656.1 | 25,912.0 | 27,021.7 | 4.3 | NA |
IFRS 15 came into effect on 1 January 2018 for all Canadian publicly accountable enterprises. Under the new accounting standards, revenues are recognized upon control of goods or services, impacting mainly the terminal equipment revenues in 2018.
Following extensive financial pressures due to the negative impacts of COVID-19 in 2020, the retail mobile sector showed a relative rebound in 2021 as revenues increased from $25.9 billion in 2020 to $27.0 billion, a growth rate of 4.3%. The increase was driven in part by a 9.9% increase in data revenues, which reached $12.5 B in 2021. Also, with the restrictions to retail stores and malls been lifted across the country and store traffic improving, mobile equipment and device sales increased at an 8.5% growth rate from 2020 to 2021. Despite all the challenges, mobile remained the largest sector, representing over 54.4% of all retail telecommunications revenues in 2021. Moreover, the average subscriber consumed more data than ever – a growth rate of data usage of 8.6% from 2020-2021.
There were 33.6 million mobile phone (MP) subscribers in 2021, with mobile networks covering approximately one-fifth of Canada’s geographic land mass and reaching 99% of Canadians. In 2021, advanced wireless networks such as 5G continued to deliver higher speeds than previous generation networks. 5G was available to approximately 87.8% of Canadians in 2021, compared to 53.3% in the previous year. Previous generation LTE-A reached around 97.7% of Canadians in 2021.

Long description
| Retail mobileFootnote 14 | 2020 | 2021 |
|---|---|---|
| Canadians with access to LTE (%) | 99.5% | 99.4% |
| Major roads and highways covered by LTE (%) 2020-2021 | 88.5% | 87.2% |
| Canadians with access to LTE-A (%) 2020-2021 | 97.4% | 97.7% |
| Canadians with access to 5G | 53.3% | 87.8% |
The mobile sector continued to be dominated by the three largest mobile service providers (Top 3), Bell Group,Footnote 15 Rogers, and TELUS. In 2021, these entities accounted for 88.3% of retail mobile phone (MP) revenues. The Top 3 held the majority of mobile phone (MP) revenue share in each province/territory, except in Saskatchewan where the other providers captured 58.4% of the mobile phone (MP) sector in 2021Footnote 16.
Scroll
View data
Other mobile providers include SaskTel, Freedom Mobile, Vidéotron, Bragg Communications Ice Wireless, TBayTel and other limited MVNOs.
More data on mobile and other telecommunications services can be found in Open Data and their respective sections of the Communications Market Reports.
Retail fixed Internet sector


Long description
| Retail fixed Internet | 2020 | 2021 |
|---|---|---|
| Retail fixed Internet revenues ($ billions) | $13.3 B | $14.5 B |
| Revenue growth rate (%) | 3.9% | 9% |
| Revenue CAGR (%) 5 years | 7.0% | 7.3% |
| Retail fixed Internet subscribers (millions) | 15.6 M | 16.1 M |
| Residential fixed Internet | 2020 | 2021 |
|---|---|---|
| Households with a fixed Internet subscription (%) | 93.0% | 93.7% |
| Households with access to 50/10 Mbps speeds with an Unlimited data option (%) | 89.7% | 91.4% |
| Average download speed (Mbps) | 220.4 Mbps | 258.8 Mbps |
| Subscribers to 50+ Mbps service (%) | 67.7% | 73.2% |
| Average monthly data usage (GB) | 385.6 GB/month | 443.9 GB/month |
| Monthly ARPU ($) | $63.14 | $66.95 |
| Type | Component | 2017 | 2018 | 2019 | 2020 | 2021 | Growth (%) 2020-2021 | CAGR (%) 2017-2021 |
|---|---|---|---|---|---|---|---|---|
| Residential | Access | 8,804.2 | 9,385.0 | 9,992.9 | 10,562.7 | 11,540.2 | 9.3 | 7.0 |
| Applications, equipment, and other Internet-related servicesFootnote 17 | 314.1 | 419.6 | 505.5 | 555.6 | 654.1 | 17.7 | 20.1 | |
| Total | 9,118.3 | 9,804.6 | 10,498.4 | 11,118.3 | 12,194.3 | 9.7 | 7.5 | |
| Business | Access and transport | 1,501.5 | 1,575.7 | 1,894.0 | 1,838.3 | 1,911.3 | 4.0 | 6.2 |
| Applications, equipment, and other Internet-related services | 347.2 | 385.1 | 437.6 | 379.6 | 425.0 | 12.0 | 5.2 | |
| Total | 1,848.7 | 1,960.8 | 2,331.7 | 2,217.9 | 2,336.4 | 5.3 | 6.0 | |
| All | Total | 10,967.0 | 11,765.4 | 12,830.1 | 13,336.2 | 14,530.6 | 9.0 | 7.3 |
The fact that fixed Internet service is an essential service has been especially evident during the COVID-19 pandemic during which Canadians relied on their Internet service for remote work and education, access to news and information, as well as for entertainment. As many schools and workplaces transitioned online, data usage surged substantially. Canada’s broadband networks showed resiliency and flexibility in managing increased demand and maintaining service throughout this challenging and unprecedented period.
The retail fixed Internet sector was one of two retail telecommunications sectors to experience revenue growth in 2021, growing 9% to approximately $14.5 billion. This growth is mainly attributed to the increase in residential Internet access revenues which grew from $10.6 billion in 2020 to $11.5 billion in 2021 (or 9.3% growth). Residential Internet revenues increased as households subscribed more and more to Internet packages with faster speeds and higher usage limits.
Business Internet revenues were impacted positively by the gradual reopening of businesses in 2021. This caused total business fixed Internet revenues to experience a growth rate 5.3%, from $2.2 billion in 2020 to $2.3 billion in 2021.
The number of residential subscribers continued to grow, reaching approximately 14.6 million subscriptions (or 93.7% of Canadian households) in 2021, a 3.0% increase from 2020 and more than two times the population growth rate (1.1%). Cable-based carriers and incumbent TSPs accounted for the majority of subscribers (85.3%), while other entities accounted for 14.7%, down from 15.1% in 2020.
Migration towards higher speed Internet packages continued as the needs of Canadians continued to evolve during the pandemic and expanded deployment of fibre and enhanced fixed wireless technologies improved accessibility to these types of packages. The proportion of residential subscriptions to services offering speeds of 100 Mbps or faster grew from 47.8% in 2020 to 52.7% in 2021. In 2021, 11.8% of subscriptions were for services offering speeds of at least a gigabit, compared to 8.3% in 2020.
In 2021, Canadians continued to spend more time online for school, work, and entertainment, as the average amount of data downloaded by residential Internet subscribers increased by more than 50GB/month over the past year from 353.4 GB per month in 2020 to 404.9 GB/month in 2021 (14.6% growth). The average upload amounts also grew considerably, from 32.2 GB/month to 39.0 GB/month over the same period (or 21.2% growth). Increased adoption of video teleconferencing services and large file sharing may have contributed to this growth in upload usage.
Retail wireline voice sector
| 2020 | 2021 | |
|---|---|---|
| Retail wireline voice revenues | $6.2 B | $6.0 B |
| Retail wireline voice subscribers | 12.3 M | 11.8 M |
| Revenue growth rate | -4.1% | -3.9% |
| Revenue CAGR (5 year) | -5.6% | -5.4% |
| Service | 2017 | 2018 | 2019 | 2020 | 2021 | Growth (%) 2020-2021 | CAGR (%) 2017-2021 |
|---|---|---|---|---|---|---|---|
| Retail local revenues | 6,376 | 5,999 | 5,513 | 5,246 | 5,106 | -2.7 | -5.4 |
| Retail long distance revenues | 1,095 | 1,052 | 970 | 968 | 865 | -10.7 | -5.7 |
| Total local and long-distance retail revenues | 7,471 | 7,051 | 6,483 | 6,214 | 5,971 | -3.9 | -5.4 |
In 2021, the retail wireline voice sector reported approximately $6.0 billion in revenues, with a 5.4% average annual decline since 2017. Local revenues (excluding contributions) accounted for 85.5% of retail wireline voice revenues in 2021. Long-distance revenues were approximately $865 million, declining by an average annual rate of 5.7% since 2017.
From 2017 to 2021, residential wireline voice revenues per line increased by $0.35 to $36.69 per month, while business revenues decreased by $4.39 to $48.04 per month.
The incumbent carriers accounted for 65.0% of the residential sector of retail wireline revenues in 2021, a decrease of 1.4 percentage point from 2020, but in line with the residential average of 64.9% for the 2017-2021 period. The incumbent carriers accounted for 72.2% of the business sector, a 3.9 percentage point decrease since 2020, and an 8.4% decrease since 2017. Residential revenue shares for facilities-based non-incumbent service providers represented 28.6% of residential retail wireline revenues, in 2021.
There were 24,129 payphones in 2021, generating an average of $207 in annual revenues per unit, compared to 45,327 payphones generating $430 per unit in 2017. The number of payphones dropped by over 3,900 or 14.1% from 2020 to 2021, while the average revenue per phone decreased by $105 or 33.7%.
Retail data and private line sector
| 2020 | 2021 | |
|---|---|---|
| Retail data and private line revenues | $3.0 B | $2.9 B |
| Revenue growth rate | -5.4% | -3.3% |
| Revenue CAGR (5 year) | -2.9% | -3.3% |
| Sector | Subsector | 2017 | 2018 | 2019 | 2020 | 2021 | Growth (%) 2020-2021 | CAGR (%) 2017-2021 |
|---|---|---|---|---|---|---|---|---|
| Data | Data protocols | 1,864 | 1,845 | 1,739 | 1,691 | 1,600 | -5.4 | -3.7 |
| Other | 694 | 690 | 698 | 647 | 679 | 5.1 | -0.5 | |
| Total | 2,558 | 2,535 | 2,437 | 2,338 | 2,280 | -2.5 | -2.8 | |
| Private line | Total | 721 | 700 | 695 | 624 | 585 | -6.2 | -5.1 |
| Total | Total | 3,279 | 3,235 | 3,131 | 2,962 | 2,865 | -3.3 | -3.3 |
Data and private line refer to services sold by TSPs to business customers providing private and highly secure communications channels between locations. Data and private line revenues have been in decline since 2014.
Data services are packet-based services that intelligently switch data through carrier networks. They make use of newer data protocols such as Ethernet and Internet Protocol (IP), or legacy data protocols such as X.25, asynchronous transfer mode (ATM), and frame relay to transmit data. Legacy services make up less than 0.3% of revenues. The subcategory “Other” includes network management and networking equipment.
Private line services provide non-switched, dedicated communications connections between two or more points to transport data, video and/or voice traffic.
Data posted a 2.5% loss in 2021, compared to 2020, in line with the 2017-2021 average loss of 2.8%. Private line with a 6.2% loss in 2021 exceeded the 2017-2021 average decline of 5.1%.
Incumbent TSPs accounted for approximately 67.9% of retail data revenues and 62.7% of retail private line revenues in 2021, compared to 63.5% and 71.9% for data and private line in 2017.
Wholesale
| 2019 | 2020 | 2021 | |
|---|---|---|---|
| Wholesale revenues | $4.05 B | $4.11 B | $3.94 B |
| Revenue growth rate | 5.4% | 1.3% | -4.0% |
| Revenue CAGR (5 year) | 0.8% | 0.3% | -0.5% |
| Type | Sub-type | Sector | 2017 | 2018 | 2019 | 2020 | 2021 | Growth (%) 2020-2021 | CAGR (%) 2017-2021 |
|---|---|---|---|---|---|---|---|---|---|
| Wireline | Voice | Local and access | 598.9 | 570.5 | 564.7 | 586.9 | 488.6 | -16.7 | -5.0 |
| Long-distance | 406.8 | 300.2 | 339.0 | 348.4 | 391.6 | 12.4 | -0.9 | ||
| Subtotal | 1,005.6 | 870.8 | 903.7 | 935.3 | 880.2 | -5.9 | -3.3 | ||
| Non-voice | Internet | 557.6 | 571.4 | 674.1 | 751.5 | 743.0 | -1.1 | 7.4 | |
| Data | 633.7 | 683.8 | 716.9 | 797.2 | 678.1 | -14.9 | 1.7 | ||
| Private line | 545.7 | 524.9 | 510.6 | 450.0 | 380.4 | -15.5 | -8.6 | ||
| Subtotal | 1,737.0 | 1,780.1 | 1,901.5 | 1,998.7 | 1,801.6 | -9.9 | 0.9 | ||
| All | Wireline | 2,742.7 | 2,650.9 | 2,805.2 | 2,934.0 | 2,681.8 | -8.6 | -0.6 | |
| Mobile | All | Mobile | 1,277.1 | 1,193.4 | 1,247.3 | 1,171.8 | 1,261.1 | 7.6 | -0.3 |
| All | Total | Total | 4,019.8 | 3,844.3 | 4,052.5 | 4,105.8 | 3,942.9 | -4.0 | -0.5 |
Wholesale services are services provided by one TSP to another, usually when the latter does not have end-to-end facilities of its own.
In 2021, the wholesale telecommunications sector was worth $3.9 billion, of which 32% was for the provision of mobile services and 68% for wireline services. From 2017 to 2021, wholesale mobile and wholesale wireline revenues decreased at an average annual rate of 0.3% and 0.6%, respectively.
Wholesale voice revenues declined, on average, by 3.3% annually from 2017 to 2021, whereas wireline non-voice revenues increased, on average, by 0.9% annually during the same period.
With 63.2% of wholesale wireline revenues, incumbent TSPs maintained the largest share of the wholesale wireline sector, which has decreased from 69.9% in 2020, as other facilities-based carriers (including cable-based carriers) increased their market share to 31.0%, a 5.5 percentage point increase compared to 2020.
A number of ISPsFootnote 19 depend on access services offered by the incumbent TSPs and the cable-based carriers to connect to their customers. Over the years, sales of cable-based access services, known as third-party Internet access (TPIA) services, to independent ISPs have increased, growing at an annual rate of 14.4% since 2017.
The number of wholesale high-speed Internet access lines and revenue decreased slightly in 2021. Ontario had the largest share of wholesale lines (57.9%) and revenues (57.0%) in 2021.
Scroll
View data
Information in the above figure regarding high-speed Internet wholesale revenues is from a sample of the larger ISPs. They reported approximately 79% of total wholesale Internet service revenues in 2020.
The number of wholesale Internet lines reached 1.28 million in 2021, a 4.5% decrease compared to the 1.34 million lines in 2020. It is worth noting that the number of wholesale Internet lines with download speeds of 50 Mbps and above has been increasing at an annual rate of 41.7% from 2017 to 2021, and now represents approximately half of all wholesale lines.
Wholesale Internet lines with download speeds of a gigabit per second and above saw the largest growth (221%), more than three times the number from the previous year.
Scroll
View data
Datasets available on Open Data
There are four Excel workbooks and CSV zips related to this report that have been published on the Open Data portal. They contain the data presented in the figures and tables in this section of the CMR, in addition to supplementary datasets (T-S1 to T-S5, W1 to W18, LLD1 to LLD11 and DPL1 to DPL9) that originate from earlier editions of the CMR.
Instructions: Use the table below to search for datasets available on Open Data that are related to this section of the CMR. When you have found the dataset, go to the Find a CMR Dataset page and download the workbooks Data - Telecommunications sector, Data - Wholesale (telecommunications), Data - Local and long distance, and Data - Data and private line. Search for the ‘tab name’ in the Excel workbook tabs to locate the data.
| Workbook | Tab name | Title |
|---|---|---|
| Data - Telecommunications sector | T-I1 | Overview of total telecommunications revenues |
| Data - Telecommunications sector | T-I2 | Telecommunications revenue share by sector (%) |
| Data - Telecommunications sector | T-I3 | Overview of retail vs wholesale revenue share (%) |
| Data - Telecommunications sector | T-I4 | Overview of key indicators of telecommunications financial performance |
| Data - Telecommunications sector | T-I5 | Overview of retail revenues by sector |
| Data - Telecommunications sector | T-I6 | Highlights of mobile coverage |
| Data - Telecommunications sector | T-I7 | Overview of retail fixed Internet sector |
| Data - Telecommunications sector | T-F2 | Total telecommunications revenues ($ billions) and growth rates (%) |
| Data - Telecommunications sector | T-F3 | Total revenues by type of TSP ($ billions) |
| Data - Telecommunications sector | T-F4 | Companies providing telecommunications services by type of TSP (%) |
| Data - Telecommunications sector | T-F5 | Distribution of TSPs by the number of sectors with services offered (%) |
| Data - Telecommunications sector | T-F6 | TSPs’ revenue share grouped by the number of sectors with services offered (%) |
| Data - Telecommunications sector | T-F7 | Telecommunications revenues by category and province/territory ($ millions) |
| Data - Telecommunications sector | T-F8 | Wholesale high-speed access enabled lines by region (thousands) |
| Data - Telecommunications sector | T-F9 | Subsidy paid to incumbent local exchange carriers ($ millions) and contribution rate (%) |
| Data - Telecommunications sector | T-F10 | Telecommunications capital expenditures by type ($ billions) |
| Data - Telecommunications sector | T-F11 | Capital intensity for industries with the highest capital intensity ratios (%) |
| Data - Telecommunications sector | T-F12 | Telecommunications capital intensity (%), by type of TSP |
| Data - Telecommunications sector | T-F13 | EBITDA margins by sector (%) |
| Data - Telecommunications sector | T-F14 | Retail mobile revenue market share (%) |
| Data - Telecommunications sector | T-F15 | Percentage of high-speed Internet wholesale lines by region (%) |
| Data - Telecommunications sector | T-F16 | Percentage of high-speed Internet wholesale revenues share by region (%) |
| Data - Telecommunications sector | T-F17 | Wholesale high-speed access enabled lines by download speed (thousands) |
| Data - Telecommunications sector | T-T1 | Total revenue market share (%) by type of service provider |
| Data - Telecommunications sector | T-T2 | Percentage of telecommunications revenues generated by forborne services (%) |
| Data - Telecommunications sector | T-T3 | Overview of retail mobile sector |
| Data - Telecommunications sector | T-T4 | Retail mobile and paging service revenue components ($ millions) |
| Data - Telecommunications sector | T-T5 | Retail Internet service revenues ($ millions) |
| Data - Telecommunications sector | T-T6 | Overview of retail fixed wireline voice sector |
| Data - Telecommunications sector | T-T7 | Local and long-distance retail revenues ($ millions) |
| Data - Telecommunications sector | T-T8 | Overview of retail data and private line sector |
| Data - Telecommunications sector | T-T9 | Data and private line retail revenues ($ millions) |
| Data - Telecommunications sector | T-T10 | Overview of wholesale market |
| Data - Telecommunications sector | T-T11 | Wholesale telecommunications revenues by sector ($ millions) |
| Data - Telecommunications sector | T-S1 | Telecommunications revenue distribution by region ($ billions) |
| Data - Telecommunications sector | T-S2 | Percentage of retail telecommunications revenues generated by forborne services (%) |
| Data - Telecommunications sector | T-S3 | Telecommunications investments made in plant and equipment, by type of provider of telecommunications service ($ billions) |
| Data - Telecommunications sector | T-S4 | Total 9-1-1 service revenues ($ millions) |
| Data - Telecommunications sector | T-S5 | Wireline retail telecommunications revenue market share (%) by type of service provider |
| Data - Wholesale (telecommunications) | W1 | Wholesale telecommunications revenues by market sector ($ millions) |
| Data - Wholesale (telecommunications) | W2 | Local wholesale telecommunications revenues, by major component ($ millions) |
| Data - Wholesale (telecommunications) | W3 | Local wholesale telecommunications revenues, by province ($ millions) |
| Data - Wholesale (telecommunications) | W4 | Wholesale high-speed access (HSA) based subscriptions across Canada, in percentage of total subscriptions |
| Data - Wholesale (telecommunications) | W5 | Internet-related wholesale revenues by type of service ($ millions) |
| Data - Wholesale (telecommunications) | W6 | Wholesale HSA revenues by service component ($ millions) |
| Data - Wholesale (telecommunications) | W7 | DSL and cable wholesale HSA service subscriptions by type of service (thousands) |
| Data - Wholesale (telecommunications) | W8 | DSL and cable wholesale HSA monthly revenue per enabled subscription ($) |
| Data - Wholesale (telecommunications) | W9 | Wholesale HSA-enabled subscriptions by service speed in Mbps (thousands) |
| Data - Wholesale (telecommunications) | W10 | Data protocol wholesale revenues, by service category ($ millions) |
| Data - Wholesale (telecommunications) | W11 | Wholesale mobile wireless revenues, by type of service ($ millions) |
| Data - Wholesale (telecommunications) | W12 | Local and access lines, by type of TSP (thousands) |
| Data - Wholesale (telecommunications) | W13 | Wireline wholesale telecommunications revenue market share, by type of TSP (%) |
| Data - Wholesale (telecommunications) | W14 | Wholesale local and access revenues, by type of TSP ($ millions) |
| Data - Wholesale (telecommunications) | W15 | Wholesale long distance revenues by type of TSP ($ millions) |
| Data - Wholesale (telecommunications) | W16 | Percentage of wholesale telecommunications revenues generated by forborne services (%) |
| Data - Wholesale (telecommunications) | W17 | Wholesale wireline telecommunications service revenues by type of service (%) |
| Data - Wholesale (telecommunications) | W18 | Inter-provider expenses per revenue dollar for wireline services ($) |
| Data - Local and long distance | LLD1 | Residential local telephone and long-distance service revenues by type of TSP ($ millions) |
| Data - Local and long distance | LLD2 | Business local telephone and long-distance revenues by type of TSP ($ millions) |
| Data - Local and long distance | LLD3 | Residential and business local telephone lines by type of TSP (thousands) |
| Data - Local and long distance | LLD4 | Residential and business, local and long-distance monthly revenues ($), per line |
| Data - Local and long distance | LLD5 | Local telephone retail service monthly revenues ($) per line, by type of TSP |
| Data - Local and long distance | LLD6 | Large incumbent TSPs’ retail long distance revenue market share (%), by region |
| Data - Local and long distance | LLD7 | Large incumbent TSPs' payphone revenues |
| Data - Local and long distance | LLD8 | Large incumbent TSPs' payphone quantities |
| Data - Local and long distance | LLD9 | Long distance residential and business monthly revenues ($), per line |
| Data - Data and private line | DPL1 | Retail data service revenues by classification of data protocol used ($ millions) |
| Data - Data and private line | DPL2 | Breakdown of newer data service revenues, by protocol used (%) |
| Data - Data and private line | DPL3 | Private line retail revenues by type of service provider ($ millions) |
| Data - Data and private line | DPL4 | Retail data and private line revenue market share (%), by type of TSP |
| Data - Data and private line | DPL5 | Retail data service revenue market share (%), by type of TSP |
| Data - Data and private line | DPL6 | Retail data service revenue market share (%), by type of service provider and classification of data protocol used |
| Data - Data and private line | DPL7 | Retail private line revenue market share (%) |
| Data - Data and private line | DPL8 | Forborne private line routes |
| Data - Data and private line | DPL9 | Forborne data and private line revenues (%) |
Methodology
Capital expenditures and capital intensity
Capital expenditures (CAPEX) are the costs associated with procuring, constructing, and installing new assets of telecommunications networks, to replace or add to existing assets, or to lease to others. The capital expenditures metric in this report includes data only from companies which supplied both telecommunications revenue and capital expenditure data.
Capital intensity is the ratio of capital expenditures to revenues. The capital intensity metric of the telecommunications industry found in this report was derived by dividing the total annual capital expenditures by the annual telecommunications revenues of companies that reported capital expenditures. The capital intensity of the Top 5 TSPs was calculated by dividing the sum of their capital expenditures by their year-end telecommunications revenues.
The capital intensity for all other industries found in Figure 11 was calculated by dividing the industry CAPEX by the full-year industry revenue. Industry CAPEX and industry revenue can be found in Statistics Canada Tables 34-10-0035-01 and 33-10-0226-01.
Churn rate
The average monthly churn rate is derived by dividing the number of subscribers that have left their service provider in a month by the total number of service subscribers over the same period. The higher the number, the more subscribers are leaving the provider.
Earnings before interest, taxes, depreciation, and amortization
Earnings before interest, taxes, depreciation, and amortization (EBITDA) is the operating revenue after having subtracted operating expenses but before subtracting charges for interest payments, taxes, depreciation, and amortization. The EBITDA margins were determined by dividing the total EBITDA by the total operating revenues. The EBITDA margins were calculated for companies for whom at least 80% of their total revenues are represented by Canadian telecommunications services.
Internet usage: methodology
All information in the residential fixed Internet section regarding usage of gigabytes per month, and subscriptions by advertised speed and advertised download capacity, is from data collected through surveying the larger ISPs. These larger ISPs are assigned forms which report details of the residential Internet access high-speed plans that they provide and offer. These ISPs accounted for approximately 89% of the total number of residential high-speed Internet service subscriptions in 2021.
Assignment of forms/surveys is based on the size of the entity. As such, to reduce regulatory burden, small ISPs are not required to submit this information.
Wholesale Internet lines and revenues by province/territory and region
All information in this section regarding provincial wholesale Internet lines and revenues is from data collected through surveying the larger ISPs. These larger ISPs are telecommunications providers that have historically provided regulated wholesale telecommunications services (such as WHSA, unbundled loops, and Content Delivery Network [CDN] services). They are assigned forms that report details of their wholesale high-speed Internet access lines and revenues.
Reclassification of Mobile Sector
In 2020, CRTC revamped the data collections for the mobile sector to capture mobile services in three distinct categories: 1. Mobile phone 2. Mobile broadband and 3. Other plans for mobile connected devices. This restructure has helped to align reporting changes in the industry, provide clearer and more accurate representation of the various segments, specifically mobile phone services, within the mobile sector and to assist in the monitoring efforts of new and innovative mobile solutions for industrial applications, M2M, etc., delivered on 5G mobile networks and beyond. As a result of the changes in the reporting formats, the 2021 metrics will only be comparable to the 2020 data and therefore cumulative growth rates will not be applicable and will be identified as “NA”.
In addition, there will be limited reporting on aggregate mobile statistics in the retail mobile sector, instead, the focus will be on “Mobile phone” services; this will be identified as “MP” which indicates that only mobile phone statistics were included unless otherwise specified.
Metrics that were reported prior to 2020 have been left unchanged, but 2020 and 2021 metrics were impacted. Many metrics that were closely monitored in previous CMR have been modified in 2020 and 2021, including the methodologies. For example, the average monthly data usage per user reported prior to 2020 will remain as it is, but in 2020 and 2021, this metric has been reclassified and reported as the average monthly data usage per mobile phone (MP) data subscriber. Similarly, the average revenue per user (ARPU) was reclassified as the average revenue per user for mobile phone (ARPU-MP).
Definitions
- An alternative service provider is any entity that is not an incumbent TSP. Examples of alternative service providers include Rogers, Shaw, TekSavvy, and Vidéotron.
- Average revenue per user (ARPU) is a measure of revenue generated per subscriber. This is calculated by dividing the whole-year total revenue by the average number of subscribers from the current and previous year. The number of subscribers is taken from year end data.
- Cable-based carriers are former cable monopolies that also provide telecommunications services (e.g., wireline voice, Internet, data and private line, and wireless services). Examples of cable-based carriers include Rogers, Shaw, and Vidéotron.
- Average churn rate is a measure of subscriber turnover represented as an average monthly rate.
- Earnings before interest, taxes, depreciation, and amortization (EBITDA), or Operating Margin is a metric used to measure financial performance. It is expressed as a percentage of total revenues.
- The estimated number of households in Canada is calculated by dividing the 4th quarter population estimate for Canada by Statistics Canada by the population to dwelling ratio. In turn, the population to dwelling ratio is calculated by dividing the population of Canada by the number of households found in the Statistics Canada Census 2016.
- Facilities-based service providers are any entity that own or operate transmission facilities. Examples of facilities‑based service providers include Bell Canada, Rogers, SaskTel, Shaw, TELUS, and Vidéotron.
- Fibre-to-the-home (FTTH) refers to fibre optic communication delivery system where fibre extends from a concentrator, remote or central office to a residence.
- Fibre-to-the-premises (FTTP) is the equivalent of FTTH but refers to fibre extending to a “premise” which includes fibre extended to a business instead of a residence.
- Fixed-Internet services refers to Internet access service via dial-up, DSL, cable, fibre, fixed wireless, satellite, and other technologies such as Wi-Fi where access is provided to a precise and geographically constrained location; Internet transport service; and other non-connectivity Internet-related services such as equipment, web hosting, data centre services, etc.
- Fixed wireless service providers are any entity that provides its services over a wireless network that uses either licensed or unlicensed spectrum to provide communications services, where the service is intended to be used in a fixed location. Examples of fixed wireless service providers include SSi Canada and Xplore.
- HSPA, HSPA+, LTE, LTE-Advanced (LTE-A), 5G: High-Speed Packet Access (HSPA) and Long-Term Evolution (LTE) are protocols or standards used for communications between a mobile phone and cell towers in mobile networks. HSPA is also referred to as 3G (third generation) cellular while LTE is referred to a 4G (fourth generation) cellular. HSPA+, or evolved High-Speed Packet Access, is a form of HSPA that uses technical measures to provide faster transmission speeds. LTE is the current standard that is now widely deployed in most mobile networks, while LTE-Advanced (LTE-A) is an enhancement of the LTE standard. 5G (NR) New Radio is a new radio access technology (RAT) that is referred to as the fifth generation. These networks promise to deliver significantly faster speeds, lower latency, and gains in spectral efficiency than prior generational networks, among other benefits.
- Incumbent local exchange carrier (ILECs) are incumbent entities providing local voice services. Examples of incumbent local exchange carriers include Bell Canada, Execulink, SaskTel, Sogetel, and TELUS.
- An Incumbent Telecommunications Service Provider (TSP) is a company that provides local telecommunications services on a monopoly basis prior to the introduction of competition. These can be further categorized as large and small incumbent TSPs.
- An independent Internet service provider (ISP) refers to ISPs that are not cable-based carriers or incumbent TSPs. Examples of independent ISPs include CIK Telecom, TekSavvy, Verizon Canada, and Xplore.
- Large incumbent TSPs serve relatively large geographical areas, usually including both rural and urban populations, and provide wireline voice, Internet, data and private line, wireless, and other services. Examples of large incumbent TSPs include Bell, SaskTel, and TELUS.
- Mobile Phone revenues and subscribers are derived from handheld devices that are used mainly for voice and data communications, such as cellphones and smartphones.
- Mobile Broadband revenues and subscribers include built-in and portable access devices such as hubs, dongles, tablets, laptops and netbooks; excluding revenues derived in relation to Internet access over mobile phone or handheld devices such as blackberries, iPhone and other smartphones from this category.
- Other plans for mobile connected devices should include revenues and the number of plans for all other connected peripherals and devices, M2M services (cars, smart meters, trains, consumer electronics/connected ancillary devices) that are not included in or part of the mobile phones and mobile broadband categories.
- Other facilities-based carriers refers to providers of telecommunications services that are not incumbent providers, but which own and operate telecommunications networks. Examples of other facilities-based carriers include Allstream Business and Xplore.
- Small incumbent TSPs serve relatively small geographical areas. Due to the limited size of their serving areas, these companies do not typically provide facilities-based long-distance services. However, they provide a range of wireline voice, Internet, data and private line, and wireless services. Examples of small incumbent TSPs include Execulink and Sogetel.
- Tariff services are services whose rates, terms, and conditions are set out in a Commission-approved tariff. Non-tariff services are those telecommunications services whose rates, terms, and conditions are not set out in a Commission-approved tariff. Off-tariff services are those whose prices are filed with the Commission but for which the parties have agreed to an alternate price.
- A telecommunications service provider (TSP) refers to any entity providing telecommunications services.
- The top three mobile service providers (Top 3), in terms of revenues and subscribers, consists of the Bell Group, Rogers and TELUS. The Bell Group includes Bell Canada, Bell Mobility, Bell MTS, KMTS, NorthernTel Limited Partnership, Northwestel Mobility and Télébec, Limited Partnership. In 2017, MTS Inc.’s figures were included with those of the Bell Group. In 2015, Data & Audio-Visual Enterprises Wireless Inc.’s (i.e., Mobilicity, which then became Chatr) figures were included with those of Rogers. From 2013 on, Public Mobile’s figures were included with those of TELUS. Throughout this section, the flanker brands are a subset of the Top 3, unless otherwise stated.
- Wholesale-based service providers or non-facilities-based service carriers refers to companies that generally acquire telecommunications services from other providers and either resell those services or create their own network from which to provide services to their customers. A company that owns a small number of facilities but has the vast majority of its operations on leased facilities may also be classified as non-facilities based. Examples of wholesale-based service providers and non-facilities-based carriers include CIK Telecom and TekSavvy.
- A wireless service provider (WSP) is any entity providing wireless services. Examples of wireless service providers include Bell, Rogers, SaskTel, Shaw, TELUS, and Vidéotron.
- Date modified: