Annual highlights of the broadcasting sector 2020-2021


© Her Majesty the Queen in Right of Canada, as represented by the Canadian Radio-television and Telecommunications Commission, 2022
ISSN 2564-3673
Catalogue No. BC9-33E-PDF
On this page
The two most recent broadcast years were marked by several and varied instances of societal and business shutdowns in response to the COVID-19 pandemic. These resulted in significant declines to the advertising revenues of the traditional commercial broadcasting sectorsFootnote 1 and an increased uptake by Canadians of online broadcasting content.
- The broadcasting year ending August 31 2021 (the 2021 broadcast year) saw some traditional broadcasting sectors, primarily conventional and discretionary television, rebounding closer to pre-pandemic levels while other sectors, like radio, were still struggling with declines experienced during the COVID-19 pandemic.
- At the same time, digital media broadcasting undertakings (DMBUs) continued to increase their share of total broadcasting revenues. This is consistent with the Media Technology Monitor (MTM) Fall 2021 Adoption Report that shows increasing use by Canadians of DMBU services, including 22% of Anglophones and 15% of Francophones 18+ who watch TV exclusively online, up from 5% and 2% respectively in 2012.
Scroll
View data
Scroll
View data
- The next few sections will focus on the revenues, contributions to Canadian content, profitability of Canadian broadcasters as well as listening and viewing habits of Canadians, and lastly, sections on COVID-19 subsidies provided to Canadian broadcasters and a spotlight on Ethnic broadcasting services.
- Additional data is available from the Communications Market Report – Open Data and Financial Summaries for Broadcasting Sector web pages.
Section 1: Traditional commercial and DMBU broadcasting sector revenues
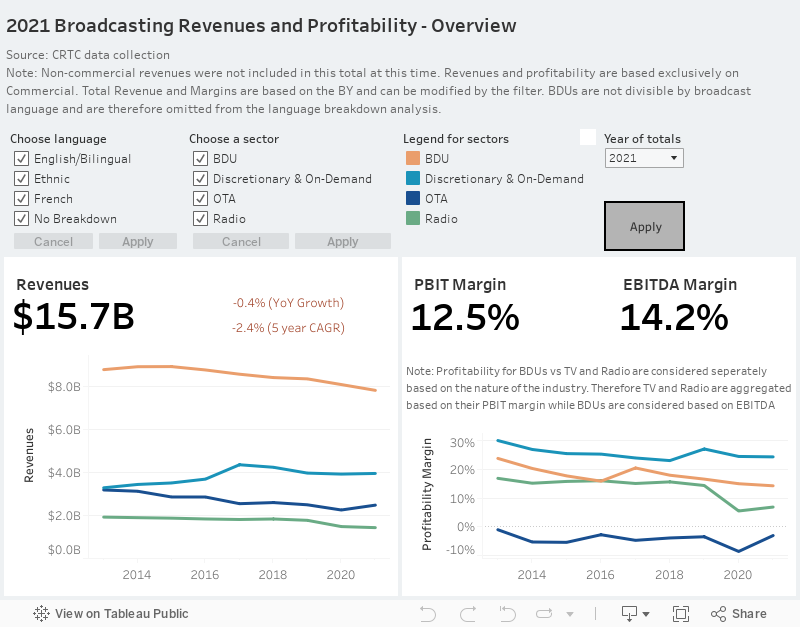
The measures instituted to mitigate the impacts of the COVID-19 pandemic continued to have significant repercussions on the sectors of the broadcasting industry that rely primarily on advertising revenues. While the conventional and discretionary television sectors experienced revenue growth in the 2021 broadcast year, the radio and broadcasting distribution undertaking (BDU) sectors continued to endure year over year revenue declines and DMBU services continued their double-digit yearly increases.
- Overall traditional broadcasting sector revenues saw a small decrease of 0.4% from the previous broadcast year, but were still 6.9% lower than the 2019 broadcast year - the last complete pre-pandemic broadcast year.
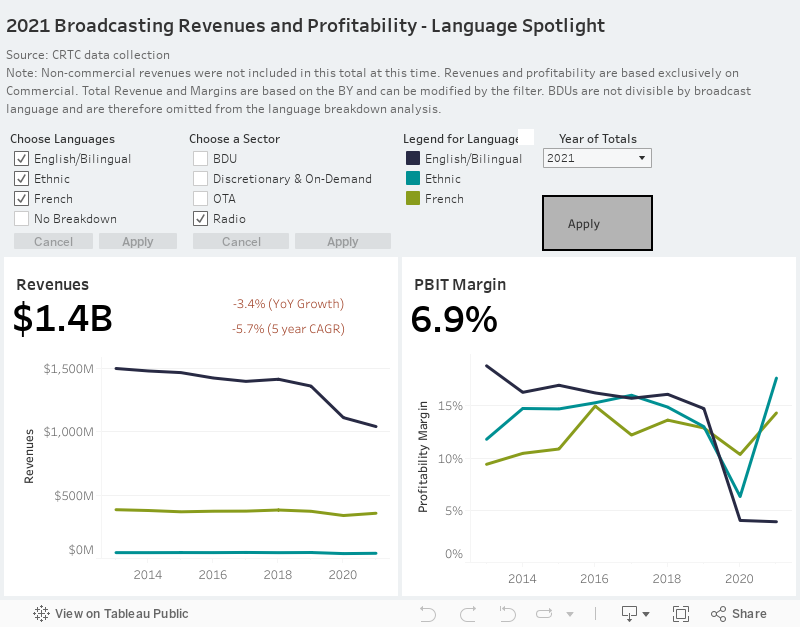
- The 0.4% overall revenue decrease over the last broadcast year was mostly due to the commercial RadioFootnote 2 and BDU sector revenues decreasing by 6.9% (-$80M) and 3.3% (-$269M) respectively. The table below provides more detail with regard to commercial radio:
Source: CRTC Annual ReturnsTable 1: Commercial Radio – Change in revenues since the last pre-pandemic broadcast year Radio Sector 2019 Revenue ($M) 2021 Revenue ($M) % Change Total 1,452 1,070 -26.3 English-language 1,161 817 -29.6 French-language 244 212 -13.1 Ethnic 47 41 -13.1 Designated marketsFootnote 3 1,058 731 -30.9 Non-designated markets 394 339 -14.1 - A large proportion of the Radio sector revenue decline since 2019 can be attributed to the sector relying more than others on local advertising revenues, which have shown only small signs of recovery.
- While BDU sector revenues are down by 6.4% (-535M) when compared to the 2019 broadcast year, this decrease is mostly in line with historical trends (-1.0% compound annual growth rate [CAGR] since 2012) and what the Commission expected as set out in the 2018 report: Harnessing Change: The Future of Programming Distribution in Canada.
- Conversely, commercial conventional and discretionary television service revenues increased by 6.9% ($91M) and 0.8% ($30M) respectively when compared to the 2020 broadcast year. While there was some recovery in 2021, as can be seen in the table below, these two sectors are also reporting substantially lower revenues than their pre-pandemic levels:
Source: CRTC Annual ReturnsTable 2: Commercial Conventional and Discretionary Television – Change in revenues since the last pre-pandemic broadcast year Television Sector 2019 Revenue ($M) 2021 Revenue ($M) % Change Conventional Television Services Total 1,554 1,424 -8.4 Larger servicesFootnote 4 1,415 1,282 -9.4 Smaller services 139 142 1.8 Discretionary Television Services Total 4,234 3,960 -6.5 English & Bilingual 3,443 3,227 -6.3 French-language 706 671 -5.0 Ethnic 85 63 -26.6 Larger services 3,337 3,147 -5.7 Smaller services 897 813 -9.4
- OMDIAFootnote 5 estimated that DMBU audio and audiovisual service revenues in Canada increased in the 2021 broadcast year by 10% (16% CAGR since 2014) and 17% (25% CAGR since 2014), respectively.
Scroll
View data
- Additional data is available from the Communications Market Report – Open Data and Financial Summaries for Broadcasting Sector web pages.
Section 2: Contributions to Canadian content and programming
- Overall for the 2021 broadcast year, contributions to Canadian content were 4.8% higher than the 2020 broadcast year. Television contributions (Canadian programming expenditures [CPE]) rebounded in the 2021 broadcast year by 6.5% while contributions by BDUs (Canadian programming) and Radio (Canadian content development [CCD])Footnote 6 were down by 2.8% and 32.8% , respectively, than in the 2020 broadcast year. The large decrease in Radio CCD is due to several factors including the significant decline of advertising revenues, the CRTC granting flexibility to radio stations to spread unpaid contributions in 2020 to future yearsFootnote 7 and the end of disbursements from larger tangible benefits obligations.
- Combining all required contribution typesFootnote 8, the Canadian broadcasting industry contributions to Canadian content are down 5.3% when compared to 2012.
- Of all sectors, the Radio sector has had the most significant decline in contributions. CCD contributions are down almost 55% from the last complete pre-pandemic broadcast year (2019) and 62.3% since 2012.
- The BDU sector contributions have steadily declined at a CAGR of 2.6% and are now down 21.3% compared to 2012. This decrease is in line with BDU revenue and subscribership declines.
- The combined conventional and discretionary television services sectors CPE have been relatively steady over the past 10 years with a CAGR of -0.2%, but are down 1.4% from 2012. Since 2017, expenditures on programs of national importance, a sub-component of the CPE, have declined at a CAGR of about 3%.
- DMBUs are currently not required to make regulatory contributions to the development of Canadian content for their audio and audiovisual services under the Broadcasting Act.
- Since 2017, expenditures by conventional and discretionary television stations on news programming have increased by 5.6% (or $39.8M) to $748M. Some of this increase can be attributed to the locally reflective news programming revenues received by conventional television stations from BDUsFootnote 9, which has averaged $46.9M since its inception in 2018.
- During this same period of time, radio station expenditures on news programming have increased by 6.0% to $100.1M.
Scroll
View data
- Additional data is available from the Communications Market Report – Open Data and Financial Summaries for Broadcasting Sector web pages.
Section 3: Profitability
- Most commercial broadcasting sector profitability during the 2021 broadcast year either improved or remained similar to the previous broadcast year. This can be at least partially attributed to the continuance of the COVID-19 subsidies during the 2021 broadcast year and on the broadcasting industry adapting to the more recent downward pressures on revenues. For example, since the start of the pandemic, operating expenses have been reduced by all commercial sectors of the industry: 16.5% by radio, 4.7% by discretionary TV, 4.6% by private conventional TV and 3.8% by BDUs.
- The profitability of two commercial broadcasting sectors decreased slightly in the 2021 broadcast year. BDU operating margins were down 0.7 percentage points to 14.2% and the Discretionary sector profit before interest and taxes (PBIT) was lower by 0.1 percentage points to 24.2% from the 2020 broadcast year.
- In comparison, during this same period, both the commercial Conventional Television and Radio sectors’ PBIT margins increased by 6.2 percentage points (to -12.4%) and 0.1 percentage points (to 5.6%), respectively. Both these were sectors were, however, still well below their pre-pandemic levels when the Radio sector posted a 17.3% PBIT margin and the Conventional Television sector posted a -7.0% PBIT margin.
- In general, commercial French-language radio stations (16.8%) were eight times more profitable than their English language counterparts (2.1%) while commercial French-language conventional television stations were slightly more profitable than commercial English-language stations (-11.9% vs. -12.5%). For discretionary services, French-language services (13.0%) were about half as profitable as English-language and Bilingual discretionary services (26.8%).
- Conventional television stations owned by smaller commercial broadcasters (those not owned by companies that file aggregate returns) were significantly more profitable in 2021 (13.2%) than their larger counterparts (-15.2%) while smaller commercial radio stations (8.3%) were also more profitable than larger radio stations (3.7%). Conversely, the discretionary services (26.9%) owned by the larger discretionary services (those owned by companies that report aggregate returns) were about twice as profitable as those owned by the smaller broadcasters (13.7%).
Scroll
View data
- Additional data is available from the Communications Market Report – Open Data and Financial Summaries for Broadcasting Sector web pages.
Section 4: Listening/Viewing of broadcasting services
- From 2015 to the spring of 2020, the average weekly tuning to traditional radio services has remained rather stable. Listening to French-language and English-language radio stations over the time period only declined by a compound average rate of -0.9% and -0.6%, respectively.
Scroll
View data
Starting in 2021, only the largest 22 markets are measured. The 2021 numbers may, therefore, not be comparable to previous years.
- Prior to the pandemic, between 2013 and 2019, the average hours per listener per week to traditional radio stations declined by 15.0%. Since the start of the pandemic, listening has declined a further 19.7%. During this time, French language radio stations have maintained a 20 to 21% share of total tuning and the English-radio stations’ share of tuning has declined from 74% to 71%, while other languages have increased their share of tuning from 6% to 8%.
- Since 2013, according to MTM, listening to DMBU audio services has grown yearly by a compound annual rate of 12.4% whereas listening to traditional radio has decreased by a compound annual rate of 4.7%. Overall, listening to both traditional radio and streaming audio has increased slowly by a compound annual rate of 0.5%.
Scroll
View data
Starting with 2021, only the 22 largest traditional radio markets are surveyed. The 2021 numbers may, therefore, not be comparable to previous years.
- Overall the average hours spent watching traditional television services has decreased by a compound annual rate of 2.2% or a total of 16.5% since 2013. Most of this decrease can be attributed to tuning by viewers outside Quebec, which decreased by 18.8% over this time whereas viewers in Quebec reduced their viewing by 8.8%.
- Interestingly, the viewing share of news programming during the pandemic increased about 2.5 percentage points. Whereas between 2013 and 2019, both English- and French-language news programming consistently attracted between 13 and 15 % of total viewership, during the 2020 and 2021 broadcast years, this increased to between 16 and 17%.
Scroll
View data
- According to MTM and Numeris estimates, overall viewing of audiovisual services by Canadians has remained relatively flat since 2013 at about 29-31 average viewing hours per week. During this time, however, viewing of DMBU services has increased at a compound annual rate of 9.4% to 3.8 hours per week while the average weekly hours viewing traditional television services has decreased from 29.3 hours to 25.8 hours per week.
Scroll
View data
Starting with 2021, Numeris data is used for DMBU audiovisual.
- Additional data is available from the Communications Market Report – Open Data.
Section 5: COVID-19 assistance
- Overall, COVID-19 assistance to the broadcasting industry was down in the 2021 broadcast year by 55% to $95M from $209M. Over 75% of the assistance in 2021 was in the form of the Canada Emergency Wage Subsidy.
- Note that the assistance reported does not include additional advertising spots different levels of government purchased from radio and television stations during the pandemic.
Scroll
View data
Scroll
View data
The percentage noted refers to each sector’s subsidies in relation to their total revenues for the broadcasting year.
- Additional data is available from the Communications Market Report – Open Data.
Section 6: Spotlight on Diversity
- Over the past 10 years, the availability of radio and television stations providing services to the diverse cultures in Canada has grown steadily.
- During the 2021 broadcast year, 28 ethnic radio services reported a 6.0% increase in revenues compared to the 2020 broadcast year whereas the 119 ethnic discretionary television services incurred a revenue decline of 23.1%. Adaptations to new market circumstances resulted, however, in higher PBITs for both with radio increasing its margin from 6.3% in 2020 to 17.7% in 2021 and discretionary TV increasing its margin of profit to 11.5% from 8.3% in the previous year.
- Since 2012, ethnic service revenues have slowly decreased for both sectors. Radio revenues have decreased by a CAGR of -1.1% and discretionary TV by a CAGR of -3.7%. The 2021 broadcast year was Radio’s highest PBIT margin in the past 10 years whereas discretionary TV’s PBIT margin has decreased by more than half from its 24.5% high in 2012.
- Consistent with the trend noted above that Canadians are increasing their consumption of DMBU provided services, MTM reports that newcomers to Canada are 37% less likely than Canadian-born respondents to subscribe to a paid TV service and 60% more likely to watch television almost exclusively via DMBUs.
Scroll
View data
- Additional data is available from the Communications Market Report – Open Data and Financial Summaries for Broadcasting Sector web pages.
Section 7: Methodology
CRTC data collection
The CRTC data collection has sourced its statistical and financial data from the annual returns provided by commercial and CBC/SRC radio stations, conventional television stations, discretionary services and on-demand services, for the broadcast year ending 31 August 2021.
CBC/SRC revenues include parliamentary appropriations for conventional television.
Annual returns for the broadcast year ending 31 August 2021 were required to be filed with the Commission by 30 November 2021. Data received after the compilation date is not reflected in this publication. The data reported for previous years has been updated to reflect any additional or adjusted information received by the Commission after the 31 August date for prior years’ publications.
Pursuant to Broadcasting Regulatory Policy CRTC 2015-86, the term “discretionary services” now encompasses all currently licensed services formerly known as pay and specialty services, whereas the term “on-demand service” now encompasses all licensed pay-per-view and video-on-demand services.
Media Technology Monitor (MTM)
MTM measures Canadians’ media technology adoption and use at two points in time to monitor changes in media penetration and use over the year. Telephone interviews are conducted with a regionally representative sample of Canadians who have a landline telephone service and those who rely solely on cell phone service. The fall survey includes 8,368 Canadian adults (4,379 Anglophones and 3,979 Francophones), 2,795 of which have completed an online survey introduced in the fall. An independent sample of 4,000 Canadians (2,000 Anglophones and 2,000 Francophones) is surveyed in the spring.
The CMR uses data collected from the fall surveys unless stated otherwise.
Omdia (formerly, Ovum)
Download-based audio services
Revenues of download-based audio services are estimated based on publicly available data, such as company annual reports, in addition to Canada’s other media revenues, such as physical music album sales and live music attendance revenues. These estimates are further refined using data about online audio subscriptions in the market as a benchmark.
In some cases where information is unavailable, Omdia based its revenue estimations on service providers’ market shares and revenues reported in a similar country.
Streaming audio services
Streaming audio services use different business models to which different methodologies apply. The total revenues of subscription-based digital streaming, advertisement-based digital streaming, and audio-video streams are added to determine total revenues of streaming audio services.
- Revenues of subscription-based digital streaming services (such as Spotify) are estimated based on publicly available data, including the number of subscribers and service rates/pricing, such as company annual reports and news articles. These are then used to estimate an average monthly subscription revenue per subscriber, considering all available service plans from a given provider, and distributed to the estimated number of subscribers. The estimated average monthly subscription revenue per subscriber is then multiplied by the subscriber estimate.
- Revenues of advertisement-based digital streaming and video streams are estimated based on publicly available data about traffic, advertising load and pricing, as well as video traffic and digital advertising forecasts. These estimates are further refined based on each entity’s performance in other video segments.
Subscription-based video-on-demand (SVOD) services
Revenues of SVOD services are estimated based on publicly available data on the number of subscribers and services rates/pricing, such as company annual reports and news articles. These are then used to estimate an average monthly subscription revenue per subscriber considering all available service plans from a given provider and distributed among the estimated number of subscribers. The estimated average monthly subscription revenue per subscriber is then multiplied by the subscriber estimate.
Transactional video-on-demand (TVOD) services
Revenues of TVOD services are estimated based on publicly available data, such as company annual reports, in addition to Canada’s other media revenues, such as home video and pay television revenues. These estimates are further refined using data on online video subscriptions in the market as a benchmark.
In some cases, where information is unavailable, Omdia based its revenue estimations on service providers’ market shares and revenues in a country similar to the one subject to analysis.
Advertising video-on-demand (AVOD) services
Revenues of AVOD services are estimated using publicly available and, where necessary, quantitatively modelled data (informed by analyst knowledge and assumptions) about advertising load, pricing and market share. These are then applied to video traffic and digital advertising forecast models to derive revenue estimates. These estimates are further refined based on each entity’s performance in other video segments.
Omdia defines AVOD revenue as revenue generated through the sale of in-stream video advertising (i.e., pre-roll, mid-roll, post-roll, and in-player overlays) delivered over the Internet. This excludes out-of-stream video advertising (e.g., video ads that play independently of video content, such as in-read and in-feed social video ad formats). This revenue is from advertiser spending.
The YouTube revenue figure represents YouTube in-stream video advertising revenue, which comprises revenue generated through the delivery of in-stream video advertising (i.e., pre-roll, mid-roll, post-roll, and in-player overlays) on YouTube. This does not include revenue generated by static display, dynamic display ads, or search ads delivered on the YouTube platform. This revenue is from advertiser spending.
The broadcaster company revenue figures represent the total in-stream video advertising revenue generated by the combined total of each player’s online video properties.
The Facebook revenue figure comprises revenue generated through the delivery of in-stream video advertising (i.e., mid-rolls) placed in videos viewed on the Facebook platform. This includes videos viewed within the News Feed, Suggested Videos, and Facebook’s recently launched Watch platform. This revenue is from advertiser spending.
Out-of-stream video advertising revenue comprises revenue generated through the delivery of out-of-stream advertising (i.e., video ads that are served outside of the video player). This includes in-feed video advertising on all social networks. It also includes out-of-stream video advertising placed on digital publishers’ sites and interstitial video advertising delivered within mobile apps. This revenue is from advertiser spending.
Mobile video advertising comprises revenue from in-stream video advertising (pre-rolls, mid-rolls, post-rolls) and out-of-stream video advertising delivered over the Internet to, viewed on, and formatted for mobile devices.
Desktop and laptop video advertising comprises revenue from in-stream video advertising (i.e., pre-rolls, mid-rolls, post-rolls) and out-of-stream video advertising delivered over the Internet to desktop PCs and laptops.
Connected TV video advertising comprises revenue from in-stream video advertising (i.e., pre-rolls, mid-rolls, post-rolls) delivered over the Internet to smart TVs, media streamers, games consoles, and connected set-top boxes.
Omdia has restated past years Internet-based video revenue estimates, to integrate newly publicly disclosed information from entities offering services and collecting revenues in Canada. This may affect year-over-year comparisons.
Numeris
Audience measurement data is important not only to industry stakeholders, who use the data to help sell air time to advertisers, but also to the CRTC, which uses the data to assess the effectiveness of its policies by understanding the reach of programming across the country and across various demographics.
Television audience measurement data sourced from Numeris was collected by portable people meter (PPM) devices.
Prior to 2019-2020, radio audience measurement data was based on Numeris radio data from the fall surveys across Canada, Monday to Sunday from 5 a.m. to 1 a.m., with participants aged 12 or older. Due to the impact of the COVID-19 pandemic and its extenuating factors, Numeris was unable to produce the Fall 2020 Radio Release. Therefore, the Spring 2020 and Spring 2021 surveys were used in 2019-2020.
- Spring 2020 measurement across Canada, Monday to Sunday from 5 a.m. to 1 a.m., with participants aged 12 or older.
- Please note: contains no listening during the COVID-19 pandemic
- Measurement of only the top 22 markets Spring 2021, Monday to Sunday from 5 a.m. to 1 a.m., with participants aged 12 or older.
The Fall 2021 survey was used in 2020-2021.
The Numeris data presented by linguistic market divides Canada into two sections: (1) all of Canada, excluding Francophone respondents in Quebec; and (2) exclusively Francophones respondents in Quebec.
The television seasons used by Numeris were the following:
- 26 August 2013 to 31 August 2014, includes all persons 2+, Monday to Sunday, 2 a.m. to 2 a.m.
- 1 September 2014 to 30 August 2015, includes all persons 2+, Monday to Sunday, 2 a.m. to 2 a.m.
- 31 August 2015 to 28 August 2016, includes all persons 2+, Monday to Sunday, 2 a.m. to 2 a.m.
- 29 August 2016 to 27 August 2017, includes all persons 2+, Monday to Sunday, 2 a.m. to 2.a.m.
- 28 August 2017 to 26 August 2018, includes all persons 2+, Monday to Sunday, 2 a.m. to 2 a.m.
- 27 August 2018 to 30 August 2019, includes all persons 2+, Monday to Sunday, 2 a.m. to 2 a.m.
- 26 August 2019 to 30 August 2020, includes all persons 2+, Monday to Sunday 2 a.m. to 2 a.m.
- 31 August 2020 to 29 August 2021, includes all person 2+, Monday to Sunday 2 a.m. to 2 a.m.
The DMBU audiovisual figure used in 2021 represents the August 2021 figure from the Video Audience Measurement (VAM).
Definitions
AVOD refers to advertising video-on-demand service. This is an Internet-based service model in which a client typically has free access to content but is exposed to in-stream advertisements (e.g., YouTube and Facebook).
BDU revenues refers to revenues from basic and non-basic BDU services and excludes Internet-based service revenues, such as Netflix, Crave and Club Illico, but include Internet Protocol Television services such as Bell Fibe and Telus Optik TV.
Broadcasting contributions to Canadian content include Canadian content development (CCD) contributions, Canadian programming expenditures (CPE), contributions to the creation and production of Canadian programming from BDUs, and tangible benefits from ownership transactions in the form of CCD contributions and CPE.
Canadian programming expenditures refers to expenditures used to create Canadian programming and to ensure that a diversity of voices and interests are represented in our national broadcasting system. The policy objectives of the Broadcasting Act include encouraging the development of Canadian expression and ensuring that each element of the Canadian broadcasting system contributes to the creation and presentation of Canadian programming, in an appropriate manner. As such, Canadian broadcasters are required to allocate portions of their annual broadcasting revenues to expenditures on Canadian programming.
Canadian content development (CCD) contributions are financial contributions made by radio broadcasters to support the development and promotion of Canadian musical and spoken word content for broadcast.
Direct-to-home (DTH) refers to satellite service providers.
Discretionary services encompass all currently licensed services formerly known as pay and specialty services, pursuant to Broadcasting Regulatory Policy CRTC 2015-86.
Earnings before interest, taxes, depreciation and amortization (EBITDA) is a metric used to measure financial performance. It is expressed as a percentage of total revenues.
IPTV refers to Internet Protocol Television, such as Bell Fibe and Telus Optik TV, but excludes Internet-based services, such as Netflix, Crave and Club Illico.
On-demand services encompass all licensed pay-per-view (PPV) and video-on-demand (VOD) services, pursuant to Broadcasting Regulatory Policy CRTC 2015-86.
PBIT refers to profit before interest and taxes.
Programs of national interest (PNI) are programs from the following categories: including drama and comedy, long-form documentary, and specific Canadian award shows that celebrate Canadian creative talent. For French-language broadcasters, PNI also include music video and variety programs:
- Long-form documentary (category 2b);
- Drama and comedy (category 7);
- Music and dance (including music video clips and music video programs) and variety (categories 8 and 9) in the French-language market; and
- English-language and French-language award shows (which fall under General entertainment and human interest (category 11)).
SVOD refers to subscription-based video-on-demand service. This is an Internet-based service model in which a client pays a subscription fee to gain access to a library of content. This category includes services that air the content of the library according to a linear schedule (e.g., Sportsnet Now) and services that permit a user to choose from a catalogue of content that is available at any time (e.g., Netflix and Amazon Prime Video).
Total broadcasting revenues include revenues from private commercial and CBC/SRC conventional television, discretionary and on-demand services, private commercial and CBC/SRC radio services, as well as BDUs. They do not include Internet-based services unless stated otherwise.
TVOD refers to transactional video-on-demand service. This is an Internet-based service model in which a client pays for specific content but generally does not pay to access the service itself (e.g., iTunes, Microsoft Movies & TV, and the PlayStation Network).
- Date modified: